

Michigan · 2026 general election · Analysis
No clear partisan edge in Michigan’s early returns.
The county pattern is close to 2022 and 2024. Changing voting habits complicate what the early numbers mean.
Read the evidence01 / The participation record
Michigan’s early totals measure participation, not candidate choice.
Michigan has recorded 1,704,715 absentee returns and early in-person ballots in the October 29 snapshot. That is evidence of participation. It does not tell us which candidates those voters chose.
Since the October 28 snapshot, the state has recorded 81,293 more absentee returns and 70,950 more early in-person ballots. Those changes include reporting updates and corrections; they are not a count of ballots cast on one day. Harris-won counties supply 52.5% of absentee returns, up from 52.3% in the previous snapshot.
The useful question is whether the places supplying those ballots look different from earlier elections. On the available county-level evidence, the pattern remains close to the historical checkpoints. A clear Republican or Democratic vote advantage cannot be established from these records.
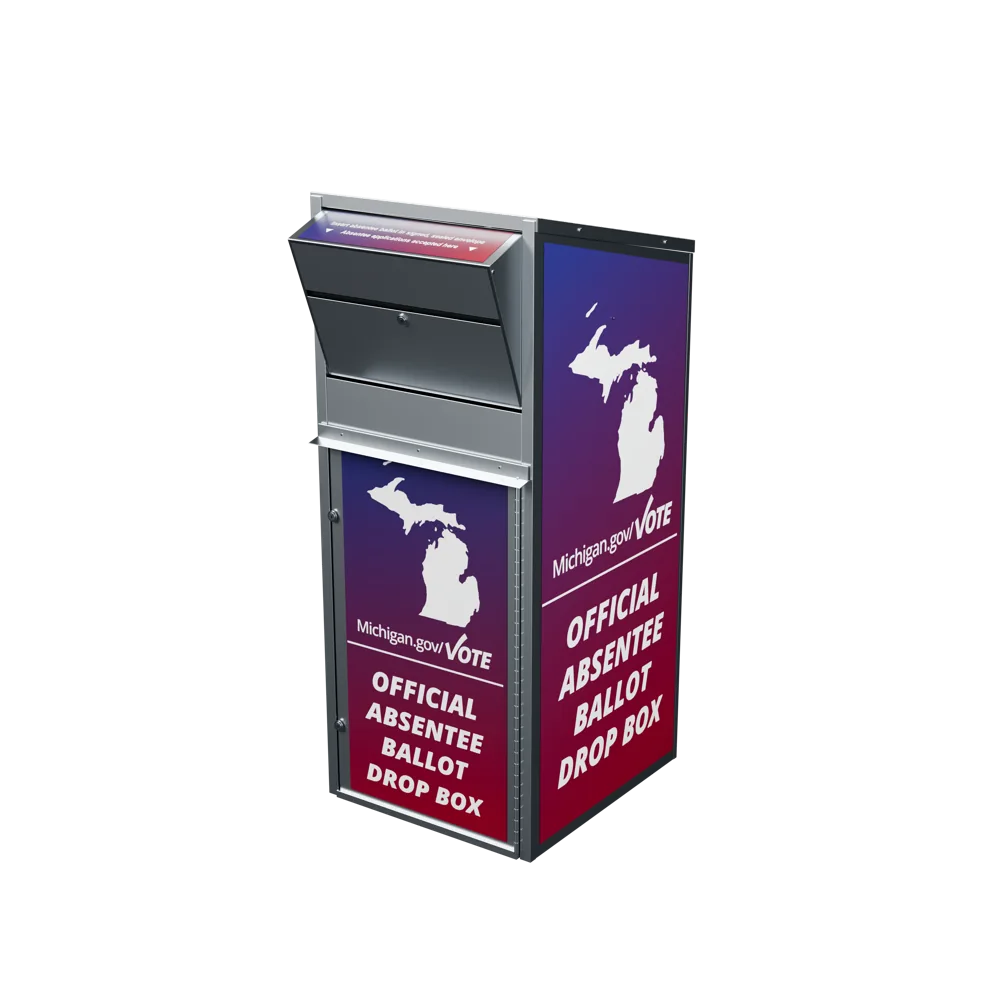
- Absentee ballots returned
- 1,346,372
Ballots returned by mail, drop box or clerk delivery enter the same absentee count.
The dashboard does not report a separate drop-box total. Early in-person ballots are recorded separately below.
- Early in-person ballots
- 358,343
- Recorded at early-voting sites, kept separate from absentee returns.
- Combined participation
- 1,704,715
- Absentee returns plus early in-person voting in this snapshot.
October 29, 2026 07:14:55 AM · Source timezone unstated. Michigan Department of State participation dashboard. Michigan does not register voters by party.
02 / The Republican and Democratic readings
Republican-won counties have returned a larger share of their absentee requests.
Counties grouped by their 2024 presidential winner. Every voter in each county is included, regardless of party.
Trump-won counties 74 counties
64.4%
of requested absentee ballots returned
639,051 returned / 991,636 requested
A higher return rate does not establish a Republican lead.
The higher return rate in Trump-won counties is a favorable geographic observation about the existing absentee pool. It does not establish additional Republican voters or a Republican lead: Democrats also live in those counties, and earlier voting can replace Election Day participation.
Harris-won counties 9 counties
60.3%
of requested absentee ballots returned
707,321 returned / 1,173,167 requested
A larger geographic share does not establish a Democratic lead.
Harris-won counties supply 52.5% of absentee returns and 52.6% of combined participation. That preserves their larger contribution to the early electorate. It does not establish a Democratic vote lead or a marked expansion in their geographic share.
The return-rate gap between Trump-won and Harris-won counties narrowed from 4.5 percentage points in the October 28 snapshot to 4.2 points now. A return rate compares completed returns with requests within the same group. A share of statewide returns compares that group with all Michigan returns. These are different denominators—and neither is a candidate vote share.
Our calculations from the October 29 participation snapshot and official 2024 presidential county results. Rates use summed ballots, not averages of county percentages.
The same counties, across elections
The geographic mix is close to the historical checkpoints.
Hold the same nine Harris-won counties constant in every year. Their contribution to statewide absentee returns is similar across the available later 2022 and 2024 snapshots and the current 2026 record.
Blue counties supply 52.5% of current absentee returns. Land area is not a measure of voters or ballots.
The nine Harris-won counties
Genesee · Ingham · Kalamazoo · Kent · Leelanau · Marquette · Oakland · Washtenaw · Wayne
Each bar represents 100% of statewide absentee returns. County groups are fixed to the 2024 presidential result; they are not the parties of the voters returning ballots.
The small differences deserve a small claim. The current Harris-county share is 52.5%. At the cited historical checkpoints it ranged from 52.4% to 52.8%. These records do not establish a major geographic shift.
The 2022 files are 15 and eight days before Election Day; the 2024 files are 14 and seven days before. The current snapshot is 5 days before. These cutoffs do not match exactly; the differences cannot establish partisan momentum from these records.
Official jurisdiction files: October 24, 2022 · October 31, 2022 · October 22, 2024 · October 29, 2024. Download the comparison data.
03 / Comparing the election calendar
Historical comparisons need the same voting window.
Today’s record is five days before Election Day. The nearest verified historical files in this analysis are seven days out in 2024 and eight days out in 2022.
Earlier checkpoint · Around two weeks out
2022: 15 days before Election Day.
2024 and 2026: 14 days before. Early in-person ballots excluded.
+2.3%
2026 absentee returns versus the approximate 2022 checkpoint
At the earlier, roughly two-week checkpoints, requests were 17.2% higher than in the previous midterm, but completed returns were only 2.3% higher. The returned share of requests fell from 42.6% to 37.2%.
Against the presidential election in 2024 at 14 days out, absentee returns were 31.2% lower. Presidential and midterm elections have different electorates, contests and participation levels.
The larger request pool had not produced a similarly large increase in completed returns at that stage. That does not establish weaker final turnout or identify which party benefits.
Below the available 2024 checkpoint. Michigan has recorded 1,346,372 absentee returns on October 29, five days before Election Day, versus 1,602,831 on October 29, 2024, seven days before that election. The current count is 16.0% lower despite being two days closer to the election. This is not an exactly matched comparison, and presidential versus midterm participation and shifts between voting methods limit what it says about final turnout.
The 2022 checkpoint is three days earlier in the voting calendar. The current total is 19.5% above the 1,126,246 absentee returns recorded October 31, 2022, eight days before that election. Three extra days in the 2026 record prevent a like-for-like pace claim. Neither comparison establishes a partisan lead. The earlier two-week chart remains fixed to its labeled dates.
Exact historical figures and cutoffs
| Data date | Days before election | Requested | Returned | Returned / requested |
|---|---|---|---|---|
| October 24, 2022 | 15 | 1,810,569 | 771,967 | 42.6% |
| October 22, 2024 | 14 | 2,268,186 | 1,147,041 | 50.6% |
| October 20, 2026 | 14 | 2,121,458 | 789,476 | 37.2% |
The 2022 release was published October 25, but its worksheet is labeled October 24. We retain that one-day-earlier cutoff. The October 20, 2026 checkpoint in this section is separate from the current October 29 snapshot above.
Michigan Department of State, October 20, 2026 and its linked 2022 comparison; October 22, 2024 official release. Later absentee checkpoints: October 31, 2022 · October 29, 2024. Current figures: October 29 dashboard.
04 / What outside research adds
ABC’s Michigan analysis finds a similar partisan mix to 2024.
The comparison covers a modeled subgroup, not candidate votes.
ABC’s comparison covers habitual voters.
In L2 records through October 19, Michigan voters who participated in all four previous general elections were modeled as 58% Democratic and 40% Republican, versus 57% and 41% in 2024.
Affiliation does not identify candidate choice.
Michigan’s Senate race illustrates that limit: some self-identified Democrats have publicly said they will vote for Mike Rogers. Republicans who voted strategically in the Democratic primary are a different group. Neither example establishes the statewide size of crossover, and neither changes what the participation totals measure. Read the reported accounts, Jason Turkish source link and original sign footage.
Party labels are L2 estimates. This subgroup is not the full early electorate, and modeled affiliation cannot establish candidate choice.
ABC News, October 22, 2026 · Data through October 19 · Reviewed October 29.
What this adds: Limited change by another measure. It cannot distinguish earlier voting from additional turnout.
Why other analyses can show different partisan margins
County geography
Our analysis measures where recorded ballots come from, holding county groups fixed to the 2024 presidential result. It does not assign a party to each ballot.
Modeled party and election forecasts
Voter-file models estimate individuals’ likely affiliation. Other models estimate party shares from county patterns: Election Data Guy’s published method, for example, allocates returns using historical county data when party identification is unavailable, then projects an outcome.
These estimates answer different questions. They should not be averaged with geographic shares or presented as official votes. A forecast also requires assumptions about the voters still to come and their choices.
05 / A changing way to vote
Michigan’s expanded early voting changes the historical comparison.
The rules changed. The use of each method changed. A bigger early total can reflect a different voting schedule as well as a different electorate.
Automatic ballot delivery changes the meaning of a request.
Voters can enroll once to receive absentee ballots automatically for future elections. The current snapshot records 2,019,949 permanent-mail voters—equivalent to 93.3% of the request total.
More requests need not mean more people made a fresh, election-specific decision to vote absentee. A lower returned share need not mean weaker enthusiasm. Michigan’s permanent absentee system.
Michigan’s current early-voting system began in 2024.
Michigan’s statewide requirement for at least nine days of early in-person voting began in 2024. Voters could complete absentee ballots at clerks’ offices in 2022, but the current early-voting-site system was not yet in place.
A combined 2026 absentee-plus-early total therefore cannot be treated as the same measure as 2022 absentee returns. The state’s 2024 implementation.
National survey · Early in-person voting
21%2022→32%2024
Adoption is changing differently across voting methods.
Pew’s national post-election survey found that early in-person voting rose from 21% to 32% of voters between 2022 and 2024, while mail/absentee voting was 35% in both years.
In 2024, 35% of Republicans and 28% of Democrats reported voting early in person. Mail/absentee use was 26% among Republicans and 44% among Democrats. These are national survey findings, not Michigan estimates. They illustrate why the two methods should not be assigned the same assumed partisan composition. Pew’s 2024 findings.
Pew’s fall 2026 national survey adds another caution: 15% of Democratic candidate supporters planned or reported returning a ballot through the Postal Service, down from 22% in 2022. That concerns a particular return method, not all absentee voting. Michigan’s absentee category also includes drop-box and clerk-delivered ballots. Pew’s 2026 survey.
Voting earlier is not necessarily an additional vote. These snapshots cannot distinguish people newly brought into the electorate from people who would otherwise vote on Election Day. They also cannot show party switching within a county.
The conclusion from these records
Michigan’s county mix offers little evidence of a partisan shift.
Republican-won counties have a higher absentee return rate. Democratic-won counties contribute more recorded participation. Both observations can be true without establishing which party is ahead.
The responsible reading is that the current county mix is close to the available historical checkpoints, while changing voting habits limit what any early total can tell us about final turnout or the result.
Explore the live Michigan election trackerAll 83 counties · Current participation · Historical election results
Reporting notes
Sources and methodology
The state records participation, not candidate results.
The October 29, 2026 Michigan Department of State dashboard snapshot records absentee returns and early in-person participation. The source displays “October 29, 2026 07:14:55 AM”; it does not state the timestamp’s timezone. These are administrative participation records, not tabulated candidate results. Clerks may enter or correct records retroactively.
Requests, returns and permanent-mail totals were checked across all 83 counties. “Less than 10” remains suppressed, not zero. Changes between snapshots are newly recorded activity, not necessarily ballots cast that day.
County groups stay fixed to the 2024 presidential result.
We fix county groups to the official 2024 presidential winner. The nine Harris-won counties are Genesee, Ingham, Kalamazoo, Kent, Leelanau, Marquette, Oakland, Washtenaw and Wayne. Every other county is in the Trump-won group. Historical results were verified October 24, 2026.
Return rates divide each group’s summed absentee returns by summed requests. Geographic shares divide the group’s absentee returns by the published statewide absentee total. Neither calculation estimates candidate votes.
Historical cutoffs and suppressed counts limit comparisons.
Six official 2022 and 2024 absentee workbooks, retrieved October 25, each cover all 83 counties. Worksheet dates govern the cutoffs. No missing day is interpolated. The days before Election Day are shown for each snapshot. Matching that interval aligns the calendar; it does not remove differences in voting rules, participation or reporting.
The 2024 municipal files suppress some small counts. The nine-county totals cited for October 22 and 29 contain no suppressed return cells. Hidden values were not reconstructed. An unresolved issued-ballot total in the October 15, 2024 source is excluded from the analysis.
Registration, ballot delivery, local voting schedules, administrative reporting and differences between elections may affect comparisons. No adjustment claiming to remove adoption effects, candidate-vote estimate or winner forecast is made.
Download the current county snapshot
Download the historical geographic comparison
Official Michigan participation source
Analysis and original footage: Stephen Schumacher · MichiganRepublicanPrimary.com